Power BI Embedded Integration
Transform your applications with seamless Power BI integration. Embed interactive dashboards and reports directly into your business applications for enhanced user experience and data-driven decision making.
What is Power BI Embedded?
Power BI Embedded is Microsoft's powerful platform that allows you to integrate stunning, interactive analytics directly into your web applications, mobile apps, and portals. It enables your users to access real-time insights without leaving your application environment.
Key Benefits for Your Organization
Faster Time-to-Market
Accelerate your analytics deployment with pre-built components and APIs, reducing development time by up to 70%.
Enterprise Security
Enterprise-grade security with row-level security, Azure AD integration, and compliance certifications.
Enhanced User Experience
Provide users with seamless analytics experience without context switching between applications.
Cost-Effective Scaling
Pay-per-use model and automatic scaling ensure you only pay for what you consume.
Custom Branding
Maintain your brand identity with white-label solutions and customizable themes.
Real-time Updates
Live data refresh and real-time streaming ensure your users always have the latest insights.
Ready to Transform Your Applications?
Let us help you integrate Power BI Embedded into your applications and unlock the full potential of your data.
Power BI Report Gallery
Explore our comprehensive collection of interactive Power BI reports designed to transform your data into actionable business insights.
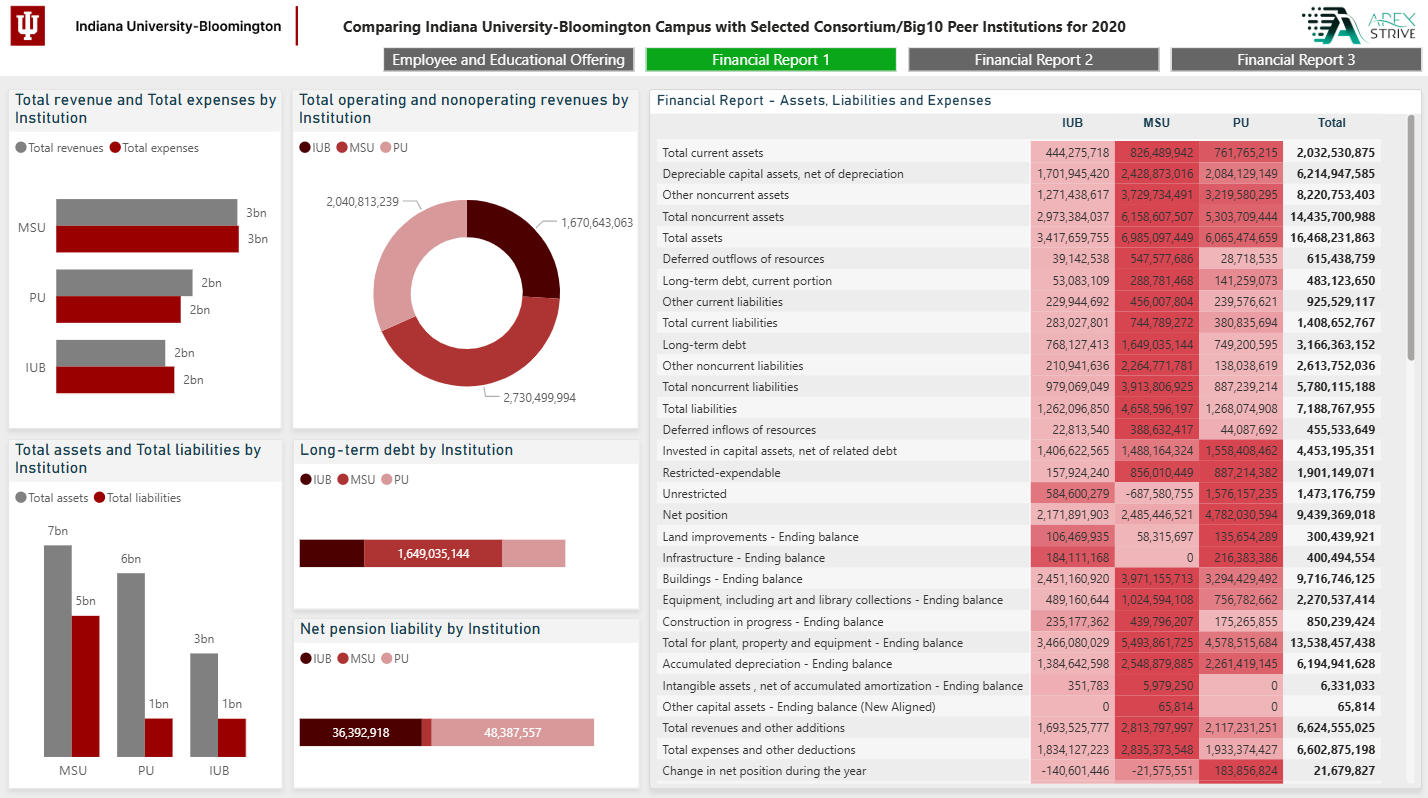
IU Bloomington Peer Analysis
Compare Indiana University-Bloomington's educational offerings, employee demographics, and financial insights against peer institutions through interactive visuals for 2020.
View Report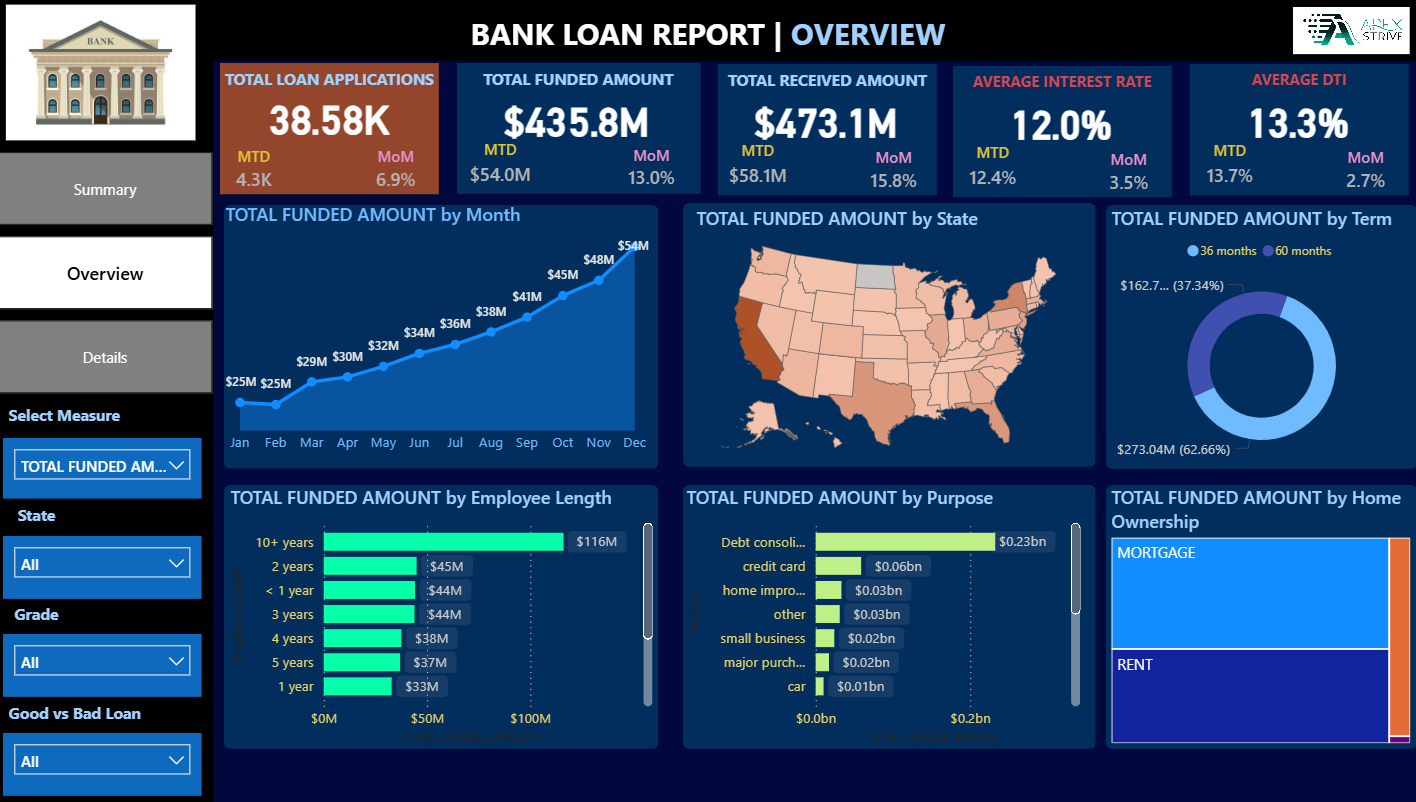
Bank Loan Performance Analysis
An interactive Power BI report providing a detailed overview of loan applications, funded amounts, loan status, and key performance metrics.
View Report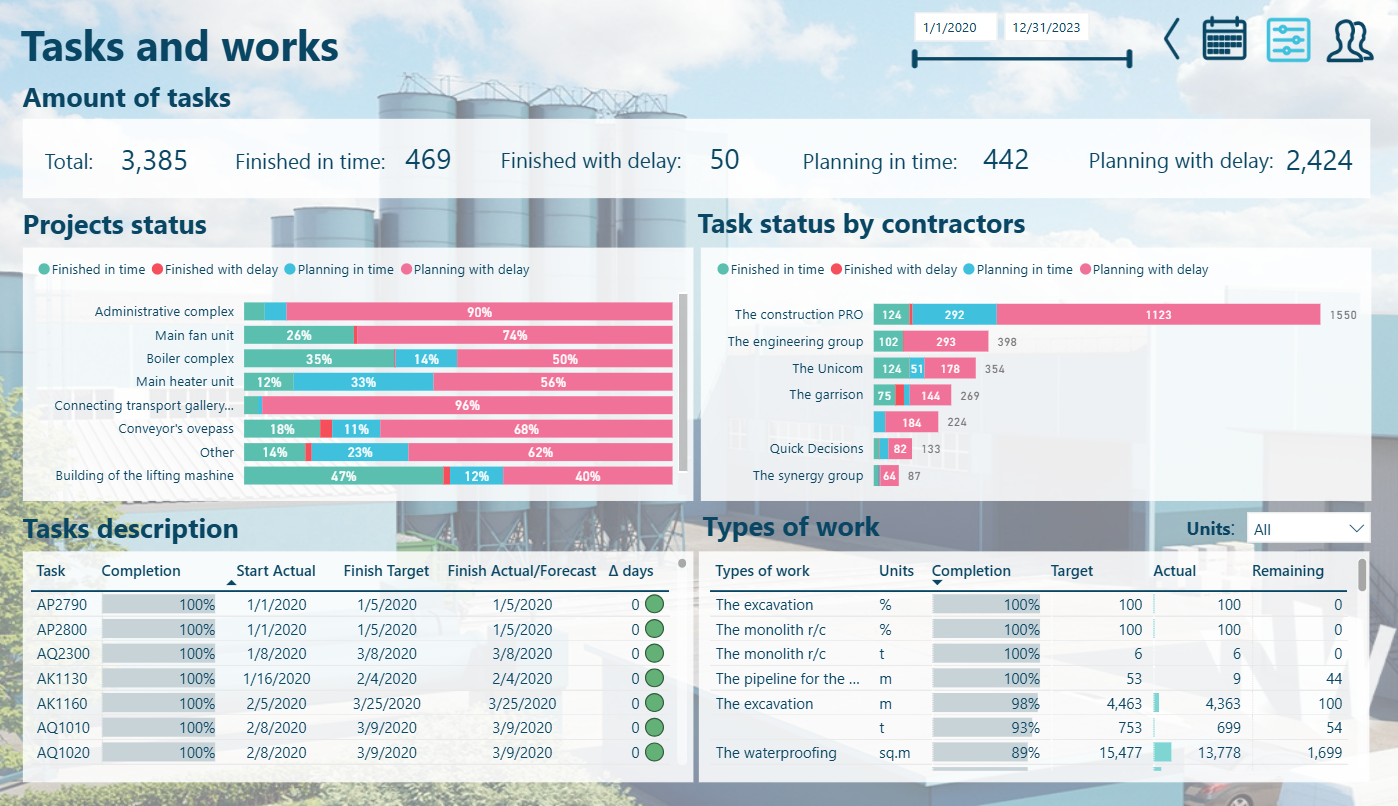
Project Management Dashboard
The Project Management Dashboard is an interactive Power BI report offering detailed visibility into project schedules, task statuses, and human resource allocations. Designed for effective project monitoring and management, it ensures timely completion and efficient resource utilization.
View Report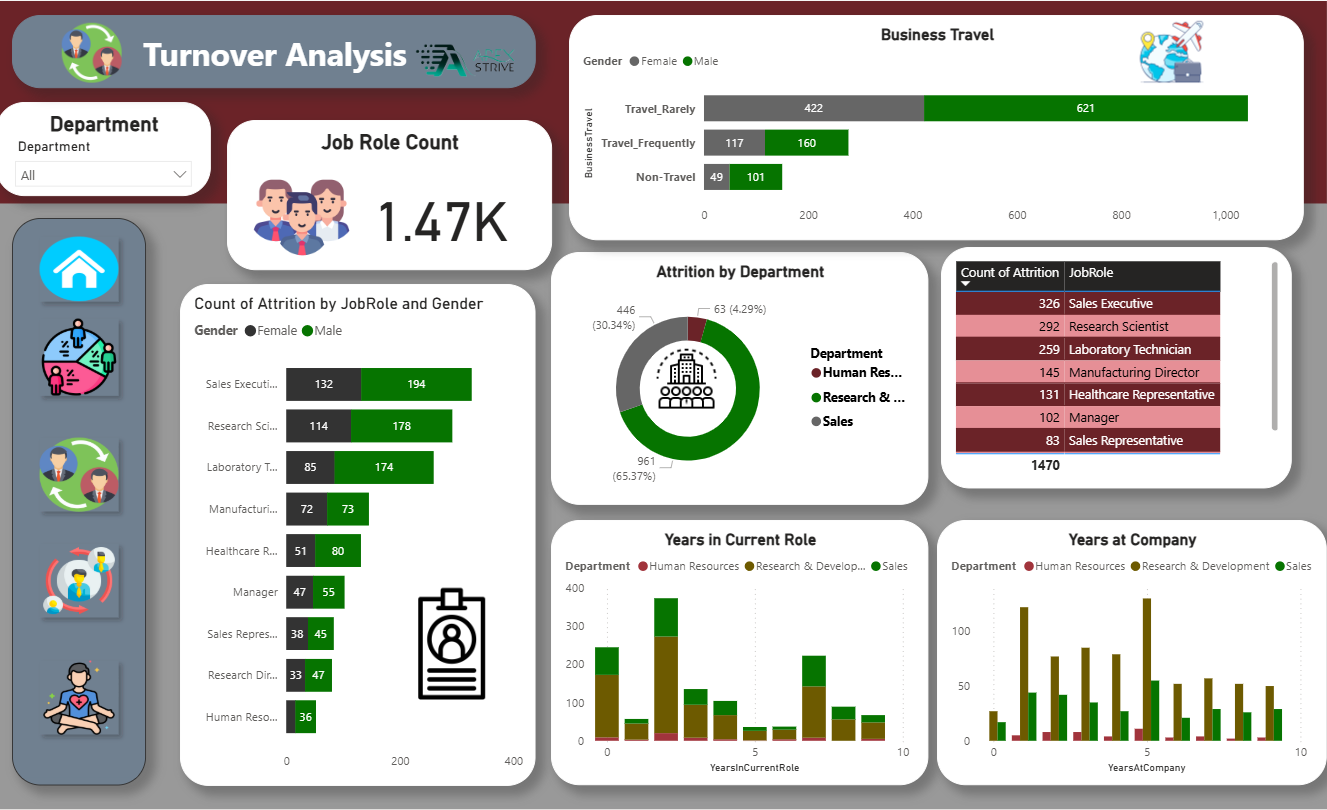
Employee Insights Dashboard
The Employee Insights Dashboard provides comprehensive analysis into employee demographics, turnover, and well-being. This interactive Power BI report helps organizations understand key employee trends and make informed decisions to enhance workforce retention, satisfaction, and overall performance.
View Report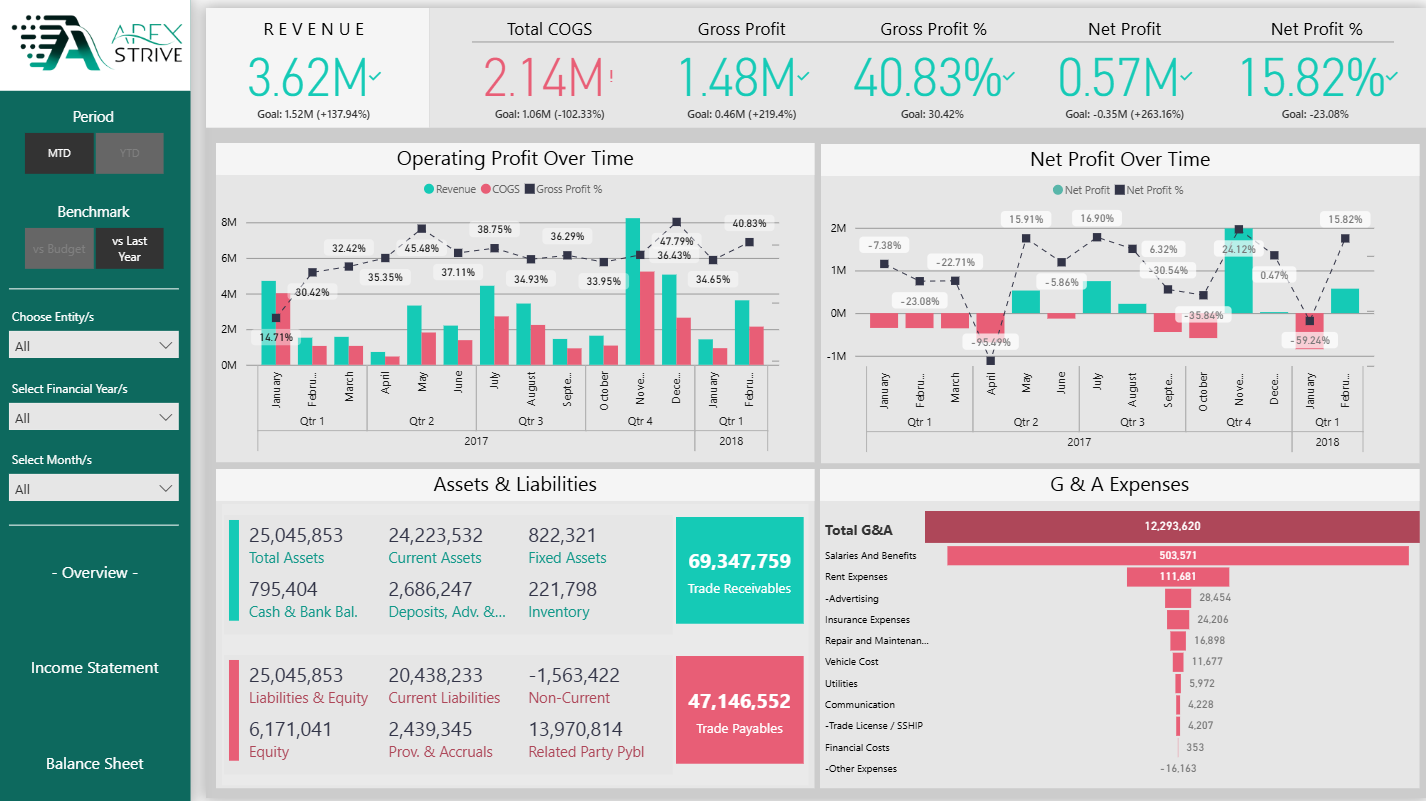
Financial Overview Dashboard
The Financial Overview Dashboard provides a concise yet comprehensive view of key financial performance metrics including revenue, profit, COGS, and G&A expenses. This interactive Power BI report is designed to help executives and finance teams monitor trends, compare benchmarks, and manage financial health effectively.
View Report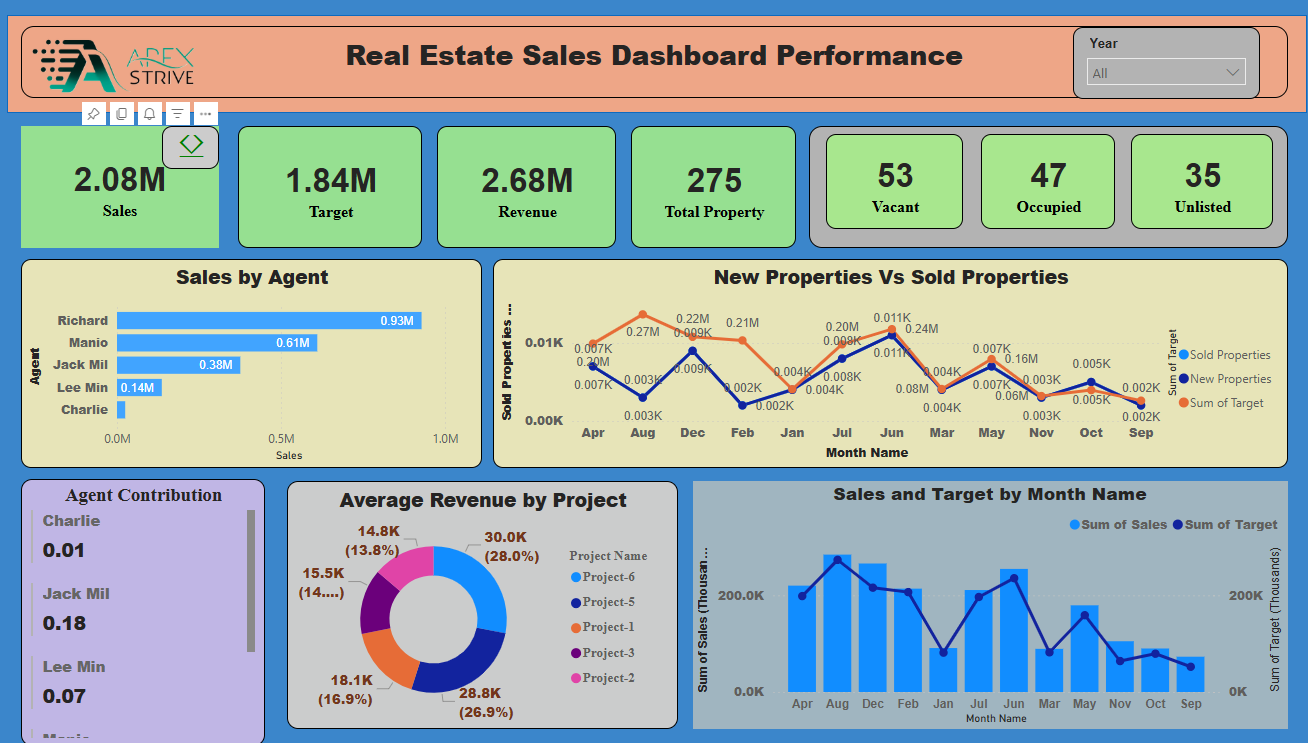
Real Estate Sales Dashboard
The Real Estate Sales Dashboard is a dynamic Power BI report that visualizes sales, revenue, target performance, and agent contributions. It is tailored for real estate companies to monitor property listings, occupancy status, and collection methods across states and projects.
View Report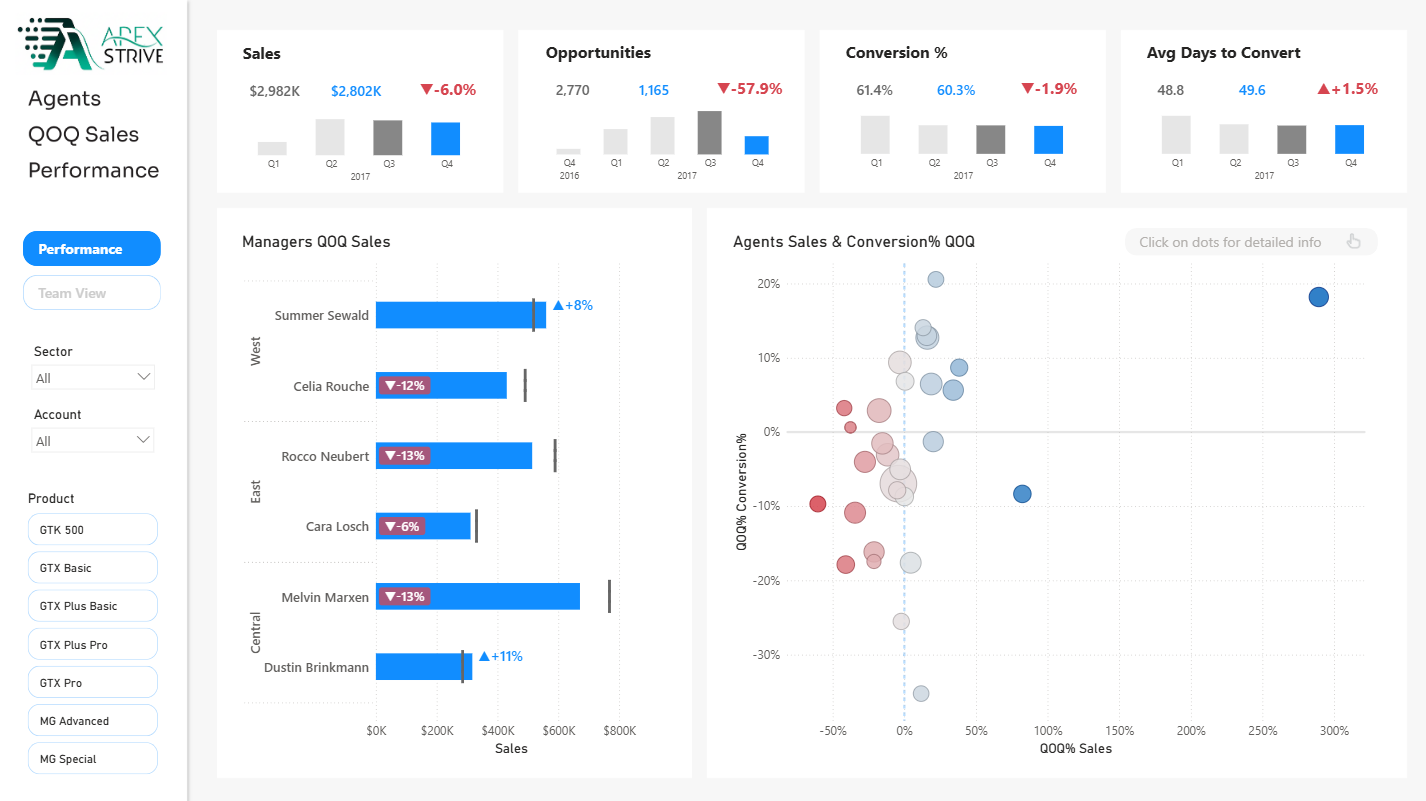
Agents QoQ Sales Dashboard
The Agents QoQ Sales Dashboard offers a visual comparison of quarterly sales trends, opportunities, and conversion rates across sales agents and teams. It empowers sales managers to assess performance shifts and identify high and low performers effectively.
View Report